Checking out the presto package
2025-04-07
Last updated: 2025-04-07
Checks: 7 0
Knit directory: muse/
This reproducible R Markdown analysis was created with workflowr (version 1.7.1). The Checks tab describes the reproducibility checks that were applied when the results were created. The Past versions tab lists the development history.
Great! Since the R Markdown file has been committed to the Git repository, you know the exact version of the code that produced these results.
Great job! The global environment was empty. Objects defined in the global environment can affect the analysis in your R Markdown file in unknown ways. For reproduciblity it’s best to always run the code in an empty environment.
The command set.seed(20200712) was run prior to running
the code in the R Markdown file. Setting a seed ensures that any results
that rely on randomness, e.g. subsampling or permutations, are
reproducible.
Great job! Recording the operating system, R version, and package versions is critical for reproducibility.
Nice! There were no cached chunks for this analysis, so you can be confident that you successfully produced the results during this run.
Great job! Using relative paths to the files within your workflowr project makes it easier to run your code on other machines.
Great! You are using Git for version control. Tracking code development and connecting the code version to the results is critical for reproducibility.
The results in this page were generated with repository version 417c64f. See the Past versions tab to see a history of the changes made to the R Markdown and HTML files.
Note that you need to be careful to ensure that all relevant files for
the analysis have been committed to Git prior to generating the results
(you can use wflow_publish or
wflow_git_commit). workflowr only checks the R Markdown
file, but you know if there are other scripts or data files that it
depends on. Below is the status of the Git repository when the results
were generated:
Ignored files:
    Ignored:    .Rproj.user/
    Ignored:    data/1M_neurons_filtered_gene_bc_matrices_h5.h5
    Ignored:    data/293t/
    Ignored:    data/293t_3t3_filtered_gene_bc_matrices.tar.gz
    Ignored:    data/293t_filtered_gene_bc_matrices.tar.gz
    Ignored:    data/5k_Human_Donor1_PBMC_3p_gem-x_5k_Human_Donor1_PBMC_3p_gem-x_count_sample_filtered_feature_bc_matrix.h5
    Ignored:    data/5k_Human_Donor2_PBMC_3p_gem-x_5k_Human_Donor2_PBMC_3p_gem-x_count_sample_filtered_feature_bc_matrix.h5
    Ignored:    data/5k_Human_Donor3_PBMC_3p_gem-x_5k_Human_Donor3_PBMC_3p_gem-x_count_sample_filtered_feature_bc_matrix.h5
    Ignored:    data/5k_Human_Donor4_PBMC_3p_gem-x_5k_Human_Donor4_PBMC_3p_gem-x_count_sample_filtered_feature_bc_matrix.h5
    Ignored:    data/97516b79-8d08-46a6-b329-5d0a25b0be98.h5ad
    Ignored:    data/Parent_SC3v3_Human_Glioblastoma_filtered_feature_bc_matrix.tar.gz
    Ignored:    data/brain_counts/
    Ignored:    data/cl.obo
    Ignored:    data/cl.owl
    Ignored:    data/jurkat/
    Ignored:    data/jurkat:293t_50:50_filtered_gene_bc_matrices.tar.gz
    Ignored:    data/jurkat_293t/
    Ignored:    data/jurkat_filtered_gene_bc_matrices.tar.gz
    Ignored:    data/pbmc20k/
    Ignored:    data/pbmc20k_seurat/
    Ignored:    data/pbmc3k/
    Ignored:    data/pbmc3k_seurat.rds
    Ignored:    data/pbmc4k_filtered_gene_bc_matrices.tar.gz
    Ignored:    data/pbmc_1k_v3_filtered_feature_bc_matrix.h5
    Ignored:    data/pbmc_1k_v3_raw_feature_bc_matrix.h5
    Ignored:    data/refdata-gex-GRCh38-2020-A.tar.gz
    Ignored:    data/seurat_1m_neuron.rds
    Ignored:    data/t_3k_filtered_gene_bc_matrices.tar.gz
    Ignored:    r_packages_4.4.1/

Untracked files:
    Untracked:  analysis/bioc_scrnaseq.Rmd
    Untracked:  rsem.merged.gene_counts.tsv
Note that any generated files, e.g. HTML, png, CSS, etc., are not included in this status report because it is ok for generated content to have uncommitted changes.
These are the previous versions of the repository in which changes were
made to the R Markdown (analysis/presto.Rmd) and HTML
(docs/presto.html) files. If you’ve configured a remote Git
repository (see ?wflow_git_remote), click on the hyperlinks
in the table below to view the files as they were in that past version.
| File | Version | Author | Date | Message |
|---|---|---|---|---|
| Rmd | 417c64f | Dave Tang | 2025-04-07 | Checking out presto |
Presto scales Wilcoxon and auROC analyses to millions of observations
The related Wilcoxon rank sum test and area under the receiver operator curve are ubiquitous in high dimensional biological data analysis. Current implementations do not scale readily to the increasingly large datasets generated by novel high-throughput technologies, such as single cell RNAseq. We introduce a simple and scalable implementation of both analyses, available through the R package Presto. Presto scales to big datasets, with functions optimized for both dense and sparse matrices. On a sparse dataset of 1 million observations, 10 groups, and 1,000 features, Presto performed both rank-sum and auROC analyses in only 17 seconds, compared to 6.4 hours with base R functions. Presto also includes functions to seamlessly integrate with the Seurat single cell analysis pipeline and the Bioconductor SingleCellExperiment class. Presto enables the use of robust classical analyses on big data with a simple interface and optimized implementation.
Install the following packages, if necessary.
remotes::install_github("immunogenomics/presto")Load {presto}.
suppressPackageStartupMessages(library("presto"))
suppressPackageStartupMessages(library("Seurat"))
Seurat object
Import raw pbmc3k dataset from my server.
seurat_obj <- readRDS(url("https://davetang.org/file/pbmc3k_seurat.rds", "rb"))
seurat_obj
An object of class Seurat
32738 features across 2700 samples within 1 assay
Active assay: RNA (32738 features, 0 variable features)
1 layer present: countsFilter.
pbmc3k <- CreateSeuratObject(
  counts = seurat_obj@assays$RNA$counts,
  min.cells = 3,
  min.features = 200,
  project = "pbmc3k"
)
pbmc3k
An object of class Seurat
13714 features across 2700 samples within 1 assay
Active assay: RNA (13714 features, 0 variable features)
1 layer present: countsNormalise.
seurat_obj <- NormalizeData(seurat_obj, normalization.method = "LogNormalize", scale.factor = 1e4, verbose = FALSE)Wilcoxon Rank Sum
Calculate gene variance and use gene with the highest variance for our testing.
gene_var <- apply(seurat_obj@assays$RNA$data, 1, var)
head(sort(gene_var, decreasing = TRUE))
LYZ S100A9 HLA-DRA CST3 TYROBP S100A8
3.598973 3.307156 3.234347 2.901707 2.791768 2.585039 Get the gene expression.
my_gene <- names(head(sort(gene_var, decreasing = TRUE), 1))
gene_exp <- seurat_obj@assays$RNA$data[my_gene, ]
head(gene_exp)
AAACATACAACCAC-1 AAACATTGAGCTAC-1 AAACATTGATCAGC-1 AAACCGTGCTTCCG-1
1.635208 1.962726 1.994867 4.521175
AAACCGTGTATGCG-1 AAACGCACTGGTAC-1
0.000000 1.726522 Create two (random) groups.
ngenes <- length(gene_exp)
set.seed(1984)
g1 <- sample(names(gene_exp), ngenes/2)
g2 <- setdiff(names(gene_exp), g1)
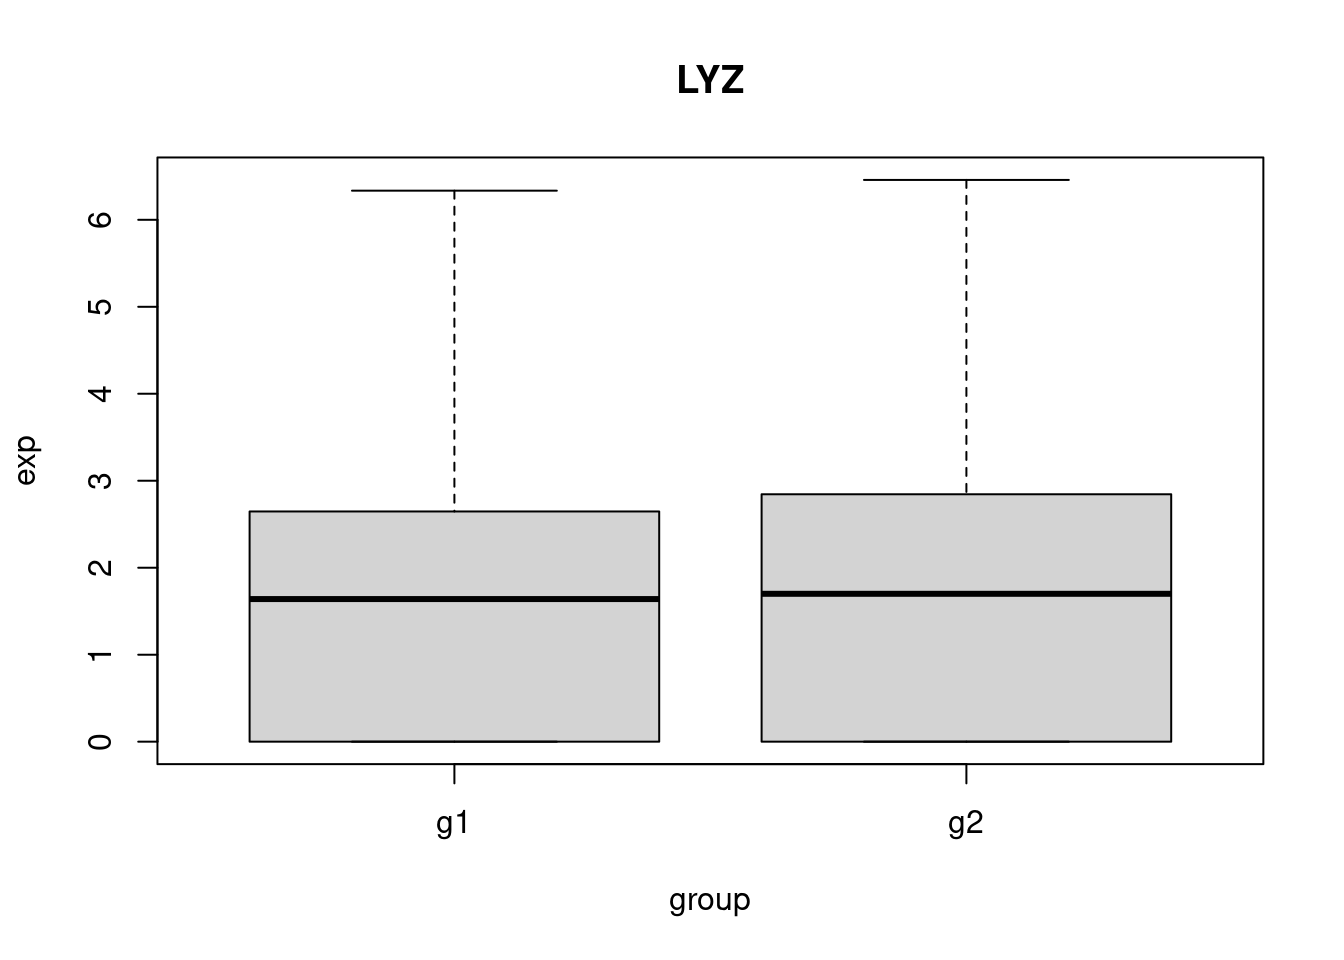
stopifnot(length(unique(c(g1, g2))) == ngenes)Plot expression.
x <- gene_exp[g1]
y <- gene_exp[g2]

my_df <- data.frame(
  barcode = c(g1, g2),
  group = c(rep('g1', ngenes/2), rep('g2', ngenes/2)),
  exp = c(x, y)
)

boxplot(
  exp~group,
  data = my_df,
  main = my_gene
)
Perform Wilcoxon Rank Sum and Signed Rank Tests using
wilcox.test.
res <- wilcox.test(exp~group, data = my_df)
res
    Wilcoxon rank sum test with continuity correction

data:  exp by group
W = 884528, p-value = 0.1731
alternative hypothesis: true location shift is not equal to 0
Fast Wilcoxon rank sum test and auROC using
presto::wilcoxauc().
my_mat <- matrix(my_df$exp, nrow = 1)
colnames(my_mat) <- my_df$barcode
rownames(my_mat) <- my_gene
y <- factor(my_df$group)
presto_res <- wilcoxauc(my_mat, y)
presto_res
feature group avgExpr logFC statistic auc pval padj
1 LYZ g1 1.802939 -0.08384549 884528.5 0.485338 0.1731151 0.1731151
2 LYZ g2 1.886785 0.08384549 937971.5 0.514662 0.1731151 0.1731151
pct_in pct_out
1 59.62963 61.18519
2 61.18519 59.62963Compare p-values.
res$p.value == presto_res$pval[1][1] TRUEAverage expression.
my_df |>
  dplyr::summarise(avgExpr = mean(exp), .by = group)
group avgExpr
1 g1 1.802939
2 g2 1.886785Log fold change.
my_df |>
  dplyr::summarise(avgExpr = mean(exp), .by = group) |>
  dplyr::summarise(across(avgExpr, ~ log(.x[1] / .x[2])))
avgExpr
1 -0.04545594The difference between logFC calculations is a known issue; use the fix suggested by slowkow.
wilcoxauc_mod <- function(X, y, groups_use = NULL, verbose = TRUE, ...) {
    ## Check and possibly correct input values
    if (is(X, "dgeMatrix")) X <- as.matrix(X)
    if (is(X, "data.frame")) X <- as.matrix(X)
    if (is(X, "dgTMatrix")) X <- as(X, "dgCMatrix")
    if (is(X, "TsparseMatrix")) X <- as(X, "dgCMatrix")
    if (ncol(X) != length(y)) stop("number of columns of X does not
                                match length of y")
    if (!is.null(groups_use)) {
        idx_use <- which(y %in% intersect(groups_use, y))
        y <- y[idx_use]
        X <- X[, idx_use]
    }

    y <- factor(y)
    idx_use <- which(!is.na(y))
    if (length(idx_use) < length(y)) {
        y <- y[idx_use]
        X <- X[, idx_use]
        if (verbose)
            message("Removing NA values from labels")
    }

    group.size <- as.numeric(table(y))
    if (length(group.size[group.size > 0]) < 2) {
        stop("Must have at least 2 groups defined.")
    }

    if (is.null(row.names(X))) {
        row.names(X) <- paste0("Feature", seq_len(nrow(X)))
    }

    ## Compute primary statistics
    group.size <- as.numeric(table(y))
    n1n2 <- group.size * (ncol(X) - group.size)
    if (is(X, "dgCMatrix")) {
        rank_res <- rank_matrix(Matrix::t(X))
    } else {
        rank_res <- rank_matrix(X)
    }

    ustat <- presto:::compute_ustat(rank_res$X_ranked, y, n1n2, group.size)
    auc <- t(ustat / n1n2)
    pvals <- presto:::compute_pval(ustat, rank_res$ties, ncol(X), n1n2)
    fdr <- apply(pvals, 2, function(x) p.adjust(x, "BH"))

    ### Auxiliary Statistics (AvgExpr, PctIn, LFC, etc)
    group_sums <- sumGroups(X, y, 1)
    group_nnz <- nnzeroGroups(X, y, 1)
    group_pct <- sweep(group_nnz, 1, as.numeric(table(y)), "/") %>% t()
    group_pct_out <- -group_nnz %>%
        sweep(2, colSums(group_nnz) , "+") %>%
        sweep(1, as.numeric(length(y) - table(y)), "/") %>% t()
    group_means <- sweep(group_sums, 1, as.numeric(table(y)), "/") %>% t()
    cs <- colSums(group_sums)
    gs <- as.numeric(table(y))
    lfc <- Reduce(cbind, lapply(seq_len(length(levels(y))), function(g) {
        group_means[, g] / ((cs - group_sums[g, ]) / (length(y) - gs[g]))
    })) |> log()

    res_list <- list(auc = auc,
                pval = pvals,
                padj = fdr,
                pct_in = 100 * group_pct,
                pct_out = 100 * group_pct_out,
                avgExpr = group_means,
                statistic = t(ustat),
                logFC = lfc)
    return(presto:::tidy_results(res_list, row.names(X), levels(y)))
}

assignInNamespace("wilcoxauc.default", wilcoxauc_mod, ns = "presto")

wilcoxauc(my_mat, y)
feature group avgExpr logFC statistic auc pval padj
1 LYZ g1 1.802939 -0.04545594 884528.5 0.485338 0.1731151 0.1731151
2 LYZ g2 1.886785 0.04545594 937971.5 0.514662 0.1731151 0.1731151
pct_in pct_out
1 59.62963 61.18519
2 61.18519 59.62963
sessionInfo()R version 4.4.1 (2024-06-14)
Platform: x86_64-pc-linux-gnu
Running under: Ubuntu 22.04.5 LTS
Matrix products: default
BLAS: /usr/lib/x86_64-linux-gnu/openblas-pthread/libblas.so.3
LAPACK: /usr/lib/x86_64-linux-gnu/openblas-pthread/libopenblasp-r0.3.20.so; LAPACK version 3.10.0
locale:
[1] LC_CTYPE=en_US.UTF-8 LC_NUMERIC=C
[3] LC_TIME=en_US.UTF-8 LC_COLLATE=en_US.UTF-8
[5] LC_MONETARY=en_US.UTF-8 LC_MESSAGES=en_US.UTF-8
[7] LC_PAPER=en_US.UTF-8 LC_NAME=C
[9] LC_ADDRESS=C LC_TELEPHONE=C
[11] LC_MEASUREMENT=en_US.UTF-8 LC_IDENTIFICATION=C
time zone: Etc/UTC
tzcode source: system (glibc)
attached base packages:
[1] stats graphics grDevices utils datasets methods base
other attached packages:
[1] Seurat_5.2.1 SeuratObject_5.0.2 sp_2.2-0 presto_1.0.0
[5] data.table_1.16.2 Rcpp_1.0.13 workflowr_1.7.1
loaded via a namespace (and not attached):
[1] RColorBrewer_1.1-3 rstudioapi_0.17.1 jsonlite_1.8.9
[4] magrittr_2.0.3 spatstat.utils_3.1-2 farver_2.1.2
[7] rmarkdown_2.28 fs_1.6.4 vctrs_0.6.5
[10] ROCR_1.0-11 spatstat.explore_3.3-4 htmltools_0.5.8.1
[13] sass_0.4.9 sctransform_0.4.1 parallelly_1.38.0
[16] KernSmooth_2.23-24 bslib_0.8.0 htmlwidgets_1.6.4
[19] ica_1.0-3 plyr_1.8.9 plotly_4.10.4
[22] zoo_1.8-13 cachem_1.1.0 whisker_0.4.1
[25] igraph_2.1.4 mime_0.12 lifecycle_1.0.4
[28] pkgconfig_2.0.3 Matrix_1.7-0 R6_2.5.1
[31] fastmap_1.2.0 fitdistrplus_1.2-2 future_1.34.0
[34] shiny_1.10.0 digest_0.6.37 colorspace_2.1-1
[37] patchwork_1.3.0 ps_1.8.1 rprojroot_2.0.4
[40] tensor_1.5 RSpectra_0.16-2 irlba_2.3.5.1
[43] progressr_0.15.0 spatstat.sparse_3.1-0 httr_1.4.7
[46] polyclip_1.10-7 abind_1.4-8 compiler_4.4.1
[49] withr_3.0.2 fastDummies_1.7.5 highr_0.11
[52] MASS_7.3-60.2 tools_4.4.1 lmtest_0.9-40
[55] httpuv_1.6.15 future.apply_1.11.3 goftest_1.2-3
[58] glue_1.8.0 callr_3.7.6 nlme_3.1-164
[61] promises_1.3.2 grid_4.4.1 Rtsne_0.17
[64] getPass_0.2-4 cluster_2.1.6 reshape2_1.4.4
[67] generics_0.1.3 gtable_0.3.6 spatstat.data_3.1-4
[70] tidyr_1.3.1 spatstat.geom_3.3-5 RcppAnnoy_0.0.22
[73] ggrepel_0.9.6 RANN_2.6.2 pillar_1.10.1
[76] stringr_1.5.1 spam_2.11-1 RcppHNSW_0.6.0
[79] later_1.3.2 splines_4.4.1 dplyr_1.1.4
[82] lattice_0.22-6 survival_3.6-4 deldir_2.0-4
[85] tidyselect_1.2.1 miniUI_0.1.1.1 pbapply_1.7-2
[88] knitr_1.48 git2r_0.35.0 gridExtra_2.3
[91] scattermore_1.2 xfun_0.48 matrixStats_1.5.0
[94] stringi_1.8.4 lazyeval_0.2.2 yaml_2.3.10
[97] evaluate_1.0.1 codetools_0.2-20 tibble_3.2.1
[100] cli_3.6.3 uwot_0.2.3 xtable_1.8-4
[103] reticulate_1.41.0 munsell_0.5.1 processx_3.8.4
[106] jquerylib_0.1.4 globals_0.16.3 spatstat.random_3.3-2
[109] png_0.1-8 spatstat.univar_3.1-2 parallel_4.4.1
[112] ggplot2_3.5.1 dotCall64_1.2 listenv_0.9.1
[115] viridisLite_0.4.2 scales_1.3.0 ggridges_0.5.6
[118] purrr_1.0.2 rlang_1.1.4 cowplot_1.1.3